Matlab产生离散信号
常见离散信号
冲击信号
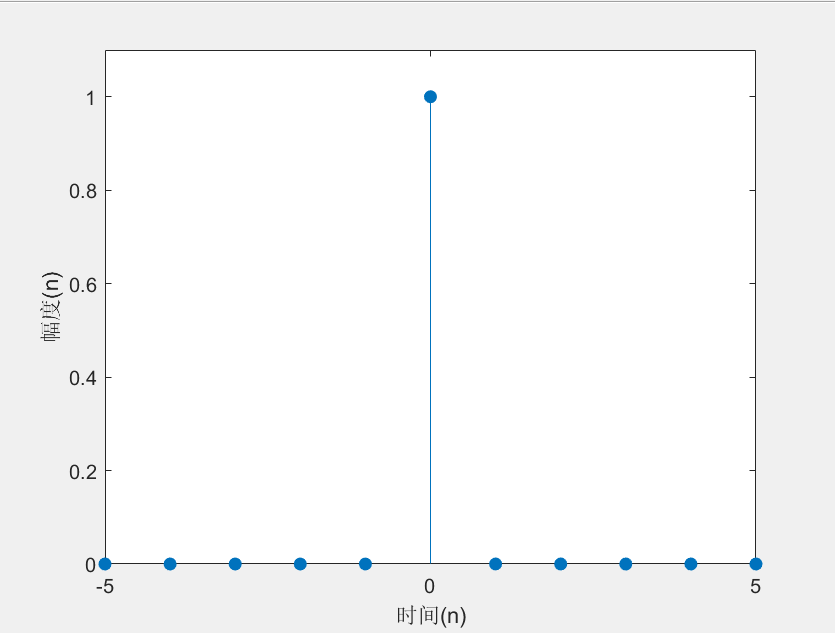
n = -5:5;x = n == 0;% 当n为0时,x的值为1stem(n, x, 'filled');axis([-5 5 0 1.1*max(x)]);%规定坐标轴的范围xlabel('时间(n)');ylabel('幅度(n)');

冲击信号
阶跃信号
n = -2:8;x = n >= 0; % 当n大于等与零时,其值为1stem(n, x, 'filled');axis([-4, 4, 0, 1.1*max(x)]);title('阶跃信号');xlabel('时间(n)');ylabel('幅度(n)');

阶跃信号
实指数序列
n1=-10; n2=10;a1=0.5; a2=2;na1=n1:0;x1 = a1.^na1;na2 = 0:n2;x2 = a2.^na2;subplot(2,2,1);plot(na1,x1);title('实指数原信号(a<1)');subplot(2,2,3);stem(na1,x1,'filled');title('实指数序列(a<1)');subplot(2,2,2);plot(na2,x2);title('实指数原信号(a>1)');subplot(2,2,4);stem(na2,x2,'filled');title('实指数序列(a>1)');

实数序列
复指数序列

n = -10:0.2:10;x = exp((-0.2+1j*0.6*pi)*n);subplot(2,2,1), plot(n, real(x));% real画出实部subplot(2,2,3), stem(n, real(x), 'filled');subplot(2,2,2), plot(n, imag(x)); % imag画出虚部subplot(2,2,4), stem(n, imag(x), 'filled');

复指数信号
随机信号
tn=0:0.2:15;N=length(tn);x=rand(1,N);subplot(2,1,1);plot(tn,x);tn=0:0.5:15;N=length(tn);y=rand(1,N);subplot(2,1,2);stem(tn,y);

随机信号